Tissue engineering 3-D cultures for cell-based screening of cancer treatments
Three-dimensional (3-D) culture can more accurately replicate the natural growth environment for many cells compared to 2-D monolayers. The extracellular matrix (ECM) plays an important role in promoting cell proliferation, differentiation, and complex cell-matrix interactions, including these effects in early in vitro stages of drug screening could yield results more predictive of in vivo assays. In our approach, we generate cell-laden hydrogel beads and incorporate elements of the ECM, including collagen and reconstituted basement membrane matrix, to provide cues from the natural microenvironment.
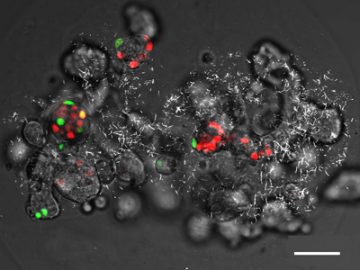
This is a transmitted light differential interference contrast image generated by collecting forward-propagating 810 nm excitation light after passing through the bead during a second harmonic generation imaging scan, overlaid with two-photon fluorescence. Cells are dispersed within the core of the bead. The back-propagated second harmonic generation signal shows the collagen fibers. The cells express the fluorescence ubiquitination cell cycle indicator (FUCCI). Scale bar represents 50 µm.
The second harmonic generation imaging shows collagen distribution within the core-shell beads. Optical sections were acquired at 5 µm intervals from the top of the bead to 300 µm into the bead.
Imaging techniques for tissue engineering and microfluidics
The tightly packed cells within a tumour model will scatter light, inducing blurring and low signal intensity when imaging. Improved imaging techniques will be crucial for analyzing how cells interact.
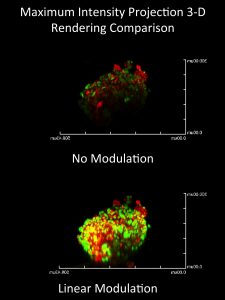
The results of two-photon cell spheroid imaging are improved by modulating the excitation laser intensity with depth, increasing the power linearly to mitigate light lost to absorption and scattering as it propagates through the sample. (presented at MicroTAS 2014)
We demonstrate a microfluidic platform for high-throughput on-chip optical clearing of breast cancer spheroids using the ClearT2 clearing method. Video showing the monitoring of a fixed MCF-7 breast cancer tumour spheroid during optical clearing using the ClearT2 formamide/PEG clearing protocol. Clearing is conducted within a microfluidic spheroid trapping device to facilitate controlled supply of clearing reagents as well as sample monitoring during the clearing process. Transmitted light imaging (left) and a two-photon fluorescence microscopy slice image (right, showing orange FUCCI fluorescent protein fluorescence within cell nuclei) show the spheroid clearing over time. Cell nuclei in the middle of the spheroid become more visible (brighter as well as better-resolved) after the clearing process. The clearing protocol first causes spheroid shrinkage and subsequent swelling, recovering close to the initial spheroid size. For more details, please see: Biomicrofluidics 10, 044107 (2016); doi: 10.1063/1.4959031
Microfluidic systems for cell-based screening of cancer treatments under controlled hypoxia
Tumour hypoxia (low oxygen levels) can impact the effectiveness of cancer treatments. Abnormal blood vessels in tumours can lead to oxygen gradients and chronic and transient (intermittent) hypoxic regions, with hypoxia/reperfusion rates of a few cycles per hour. Transient hypoxia can promote tumour aggressiveness and changes in cell phenotype compared with chronic hypoxia. Including these effects in early in vitro screening stages could yield results more predictive during subsequent in vivo tests. Since state-of-the-art in vitro platforms such as well plates, glass dishes, hypoxia chambers, and even custom stirred hypoxic vessels can’t easily reproduce these effects due to long equilibration times (hours), we use microfluidic devices which offer the potential to control and reproduce more realistic environments due to their smaller size scales.
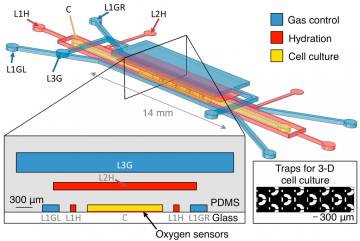
Oxygen control microfluidic device layout, showing 3-D and cross-sectional views of the device as well as the position of the integrated optical oxygen sensors within the cell culture channel. The cell culture channel (C) is surrounded on three sides by gas control channels (L1GL, L1GR, and L3G), with hydration/bubble removal channels (L1H, L2H) between each of the gas channels and the centre channel. Inset shows trapping structures for 3-D cell cultures within the cell culture channel. Please note that the 3-D view is not to scale (microfluidic layers are spaced farther apart in the illustration than in the device to permit visualization of the three layers). Cross-sectional view is to scale. For more details, please see: Grist, S.M.; Schmok, J.C.; Liu, M.-C.A.; Chrostowski, L.; Cheung, K.C. Designing a Microfluidic Device with Integrated Ratiometric Oxygen Sensors for the Long-Term Control and Monitoring of Chronic and Cyclic Hypoxia. Sensors 2015, 15, 20030-20052; doi:10.3390/s150820030. This is an open access article distributed under the Creative Commons Attribution License (CC BY 4.0).
Video showing time-varying fluidic oxygen levels within a microfluidic device. Left: Gaseous oxygen levels supplied to the microfluidic device (red), and average oxygen levels at the bottom of the water-filled cell culture channel (black), measured (using fluorescence microscopy) by the integrated ratiometric optical oxygen sensor films. Fluidic oxygen levels closely follow gaseous oxygen supply, with a fast switching time of less than 10 minutes. Right: False-colour oxygen levels (ranging from 0% (blue) to 10% (red)) measured by the integrated sensor films, overlaid upon a brightfield image of the microfluidic device with trapping structures for 3-D cultures. After equilibration, the oxygen levels are uniform across the width and length of the channel. For more information please seeSensors 2015, 15, 20030-20052; doi:10.3390/s150820030
Video showing the response of an MCF-7 breast cancer tumour spheroid to cyclic hypoxia within a microfluidic oxygen control device. Left: Spheroid size (black) and oxygen level supplied to the control device (red) during exposure to a cycling oxygen profile (cycling between 0%, 3%, and 10% oxygen). Right: Brightfield video of spheroid overlaid with the segmentation (white line) used to calculate the spheroid size plotted on the left. The spheroid increases in size when exposed to 0% oxygen and decreases again when exposed to 3% and 10% oxygen, showing evidence of dynamic swelling and shrinkage during cycling hypoxia.
Inkjet printing of living cells
Piezoelectrically actuated inkjet nozzles have been used for printing of suspensions of living cells for numerous applications including tissue engineering and drug discovery. Although inkjet cell printing systems provide high precision droplet volume dispensing capability for a wide range of ink rheology, they do not offer high reliability in the number of printed cells per drop. In addition to non-uniform distribution of cells due to sedimentation and aggregation, the observed deviation from the ideal Poisson distribution is attributed to the unexpected hydrodynamic response of cells inside the nozzle. In our work, we use high speed imaging to visualize the hydrodynamics of cell motion inside the inkjet nozzle. We are tuning the rheological properties of the fluids and studying how they affect the distribution of cells within printed droplets.
Left: cell is dispensed with the dispensed droplet. Right: cell is unexpectedly reflected backward into the nozzle! This phenomenon may reduce printing reliability. For more details please see Eric Cheng et al 2016 Biofabrication 8 015008 http://dx.doi.org/10.1088/1758-5090/8/1/015008